Visualization and inference
Now that you have a model trained, its time to see how good the model is. I have prepared two scripts for this, first is just for visualizing, and the second one is for inference, where the results will be saved as a pickle or a csv.
Visualization
The script to visualize results is Code/3_VisualizeResults.py. This script requires the trained model and a sample video. Here are the arguments:
--Video: Path to the sample video
--Weight: Path to YOLO weight file (See Model training. for more details)
--Start: Start frame
--Frames: Total number of frames, -1 means all frames
To run this on the Jay sample video, you can run this in the terminal:
python Code/3_VisualizeResults.py --Video "./Data/JaySampleData/Jay_Sample.mp4" --Weight "./Data/Weights/JayBest.pt" --Start 0 --Frames -1
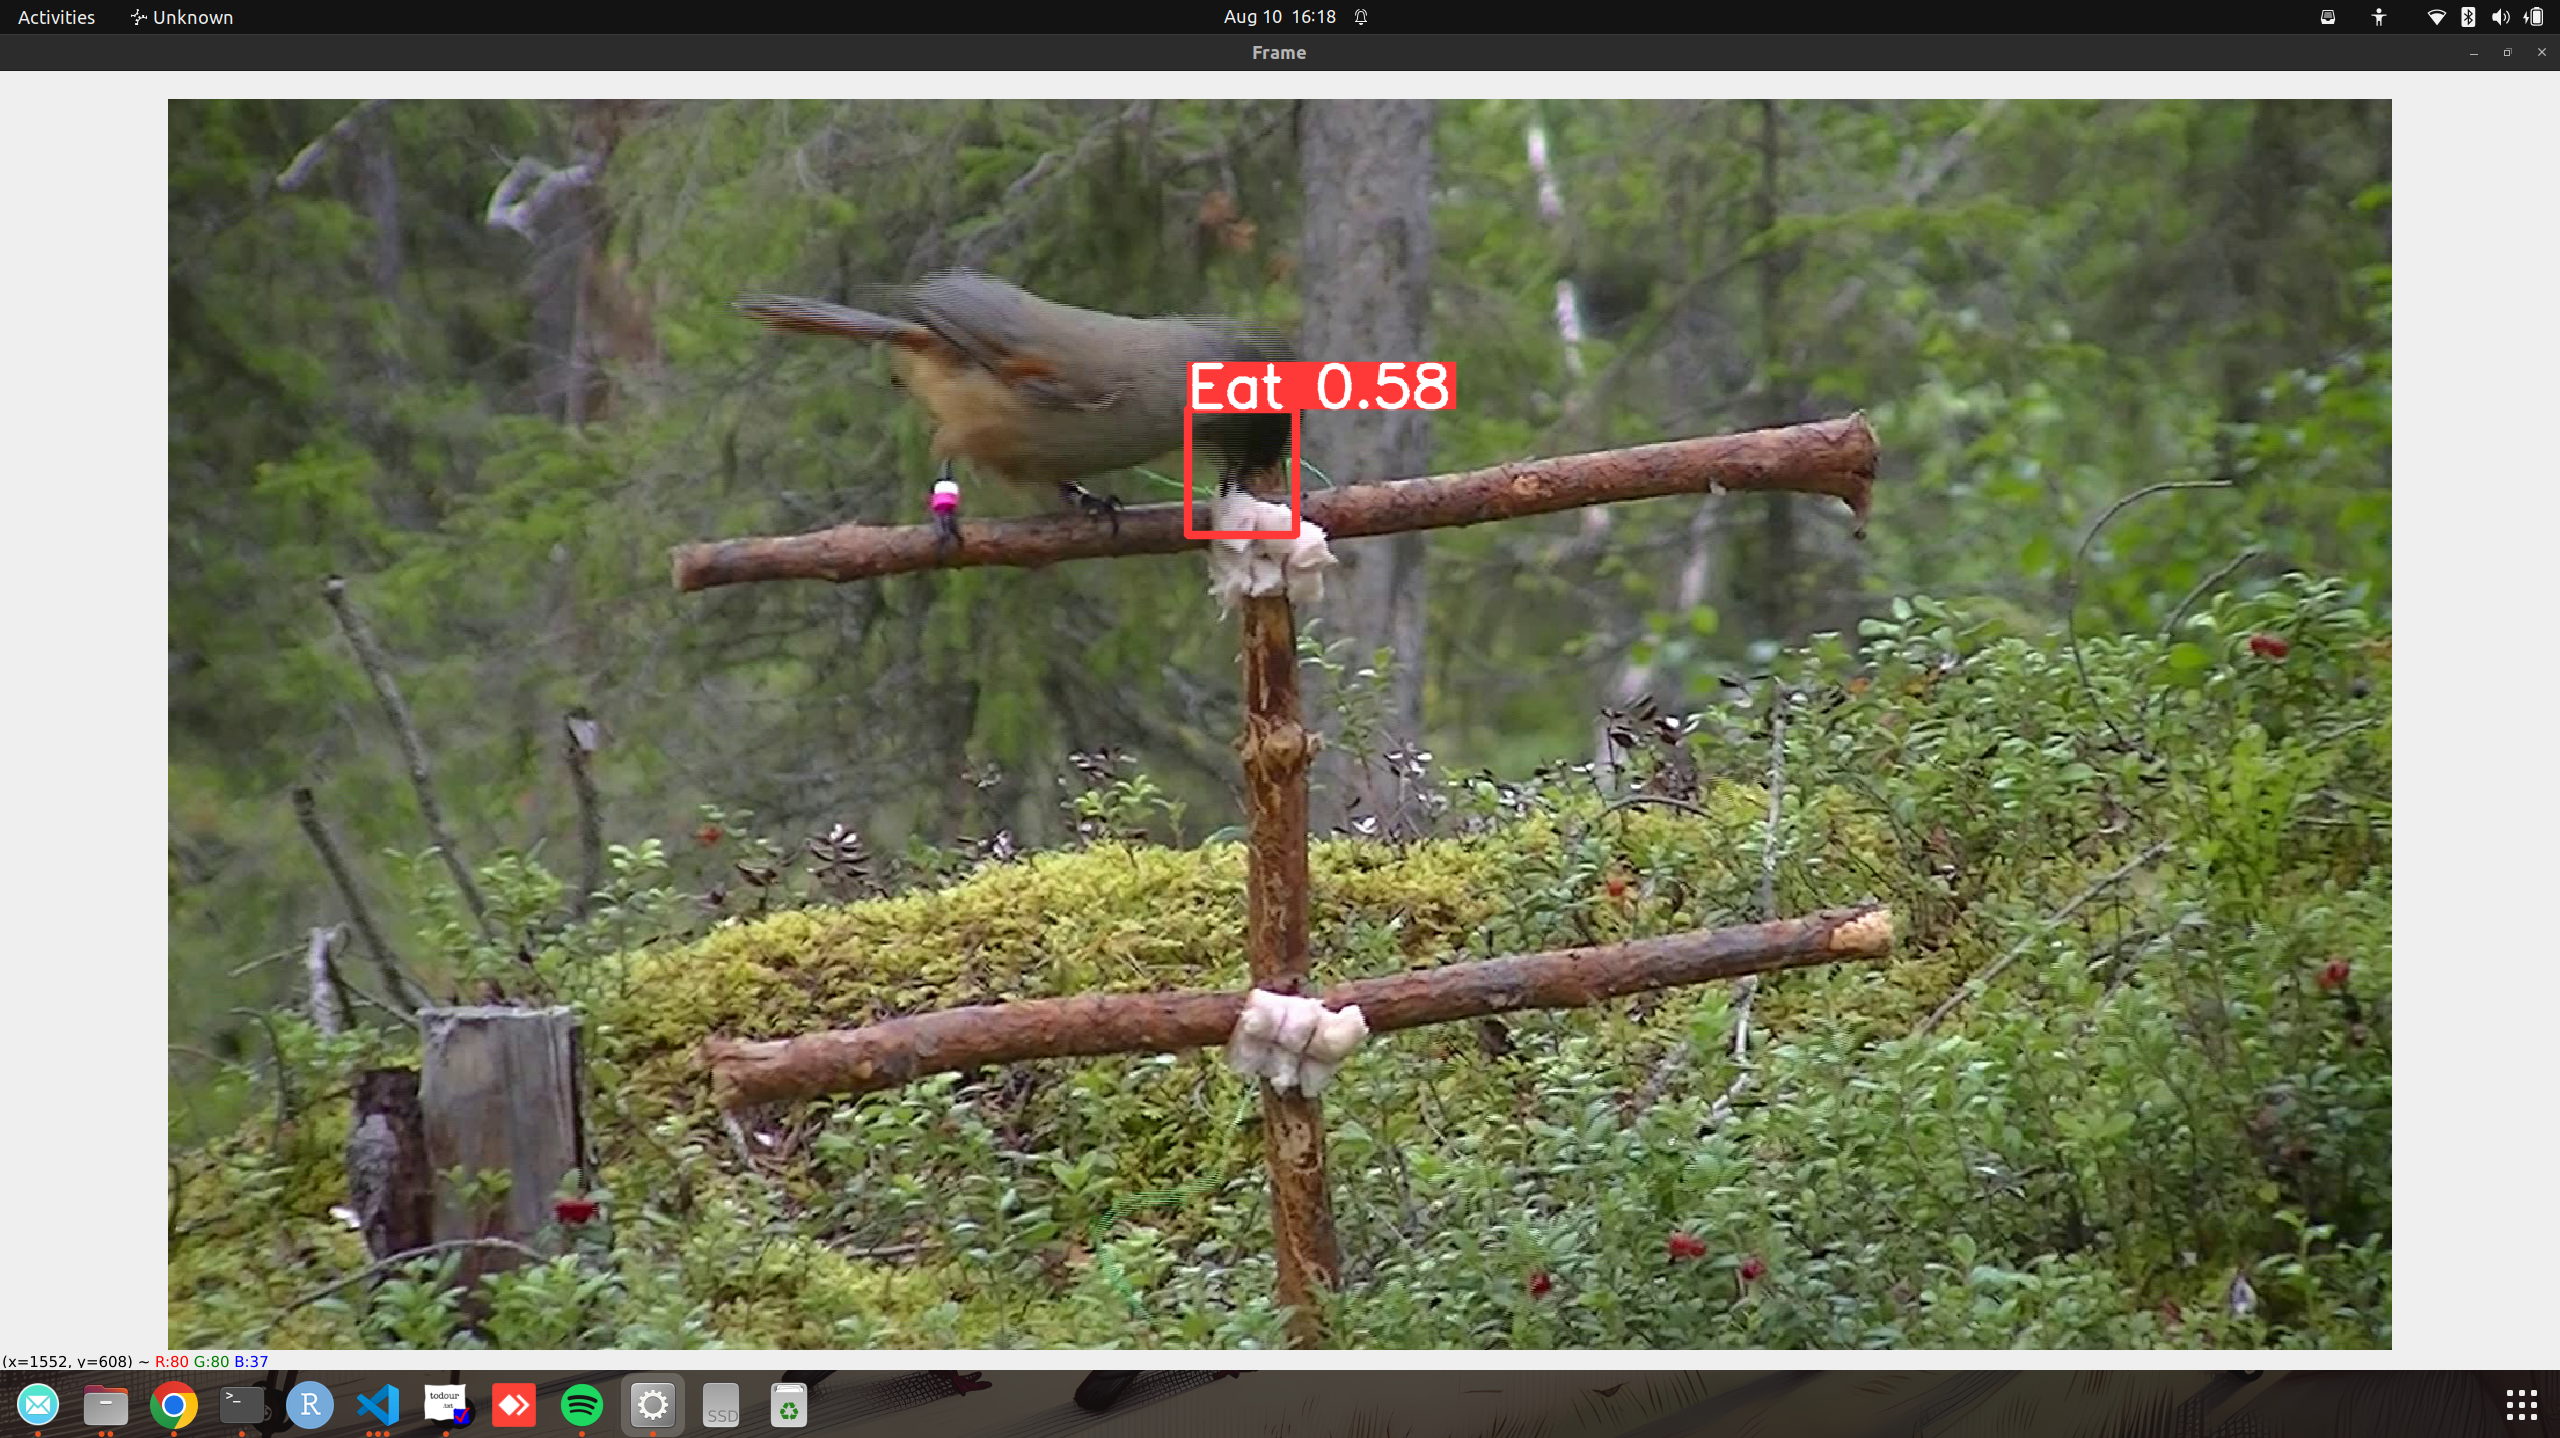
This should then launch a window where the video will be playing, with detected bounding boxes drawn on top. It will also save the results as a video in the current directory, called YOLO_Sample.mp4
Inference
If you are happy with the results, you can then proceed to run inference in a whole video. The script for this isCode/4_RunInference.py, which takes in a video and outputs results as a pickle or csv. The sample scripts only does this for 1 video, so I highly encourage you to extend the script to do multiple videos! Here are the arguments:
--Video: Path to the sample video
--Weight: Path to YOLO weight file (See Model training. for more details)
--Output: Output type, either “csv” or “pickle”
To run this on the Jay sample video, you can run this in the terminal:
python Code/4_RunInference.py --Video "./Data/JaySampleData/Jay_Sample.mp4" --Weight "./Data/Weights/JayBest.pt" --Output csv
This will run inference and save the results in a csv, with the same name as the video, in the video’s directory.
Data Formats
If you chose to save it as a pickle, the data is actually saved as a big python dictionary. You can load it back using the pickle library within python, and access the data like this:
###This is within python!!! Not the command line
import pickle

with open("Data/JaySampleData/Jay_Sample_YOLO.pkl", "rb") as f:
    data = pickle.load(f)
The dictionary is structured as follows:
{frame_number: {
    "Class": [list of classes detected],
    "conf": [list of confidence scores],
    "bbox": [list of bounding boxes]}
    }
Within the dictionary, each frame number is a key, which can be used to return detections from that frame, e.g. data[0] will return the detections from the first frame.
Within each frame, there is another dictionary, with keys “Class”, “conf” and “bbox”. These are strings of the classes detected, the confidence scores and the bounding boxes respectively. The bounding boxes are in the format of [x1, y1, x2, y2], where x1, y1 is the top left corner, and x2, y2 is the bottom right corner. If there are multiple bounding boxes detected for a given frame, the length of each list will be larger than 1. If nothing was detected in a frame, all the lists will be empty.
If you decided to output as a csv, this is what the data looks like:
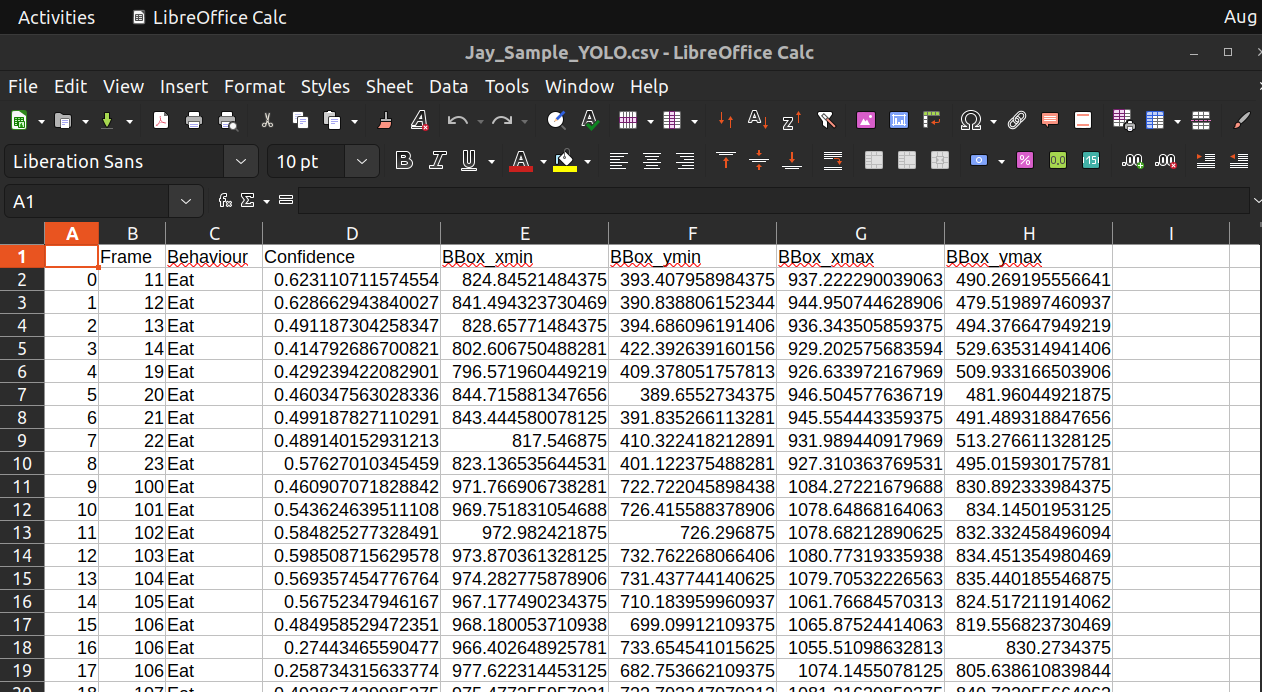
- Here are the columns:
Frame: Frame number
Behaviour: The type of behaviour detected
Confidence: The confidence score of the detection
BBox_xmin: The x coordinate of the top left corner
BBox_ymin: The y coordinate of the top left corner
BBox_xmax: The x coordinate of the bottom right corner
BBox_ymax: The y coordinate of the bottom right corner
Event Detection
After getting the detections from YOLO, the next step is to group these detections into events. For this, I use a simple tracking algorithm called SORT (Before running this step, make sure you cloned the SORT repositories underReposositories, see Introduction and installation).
You dont really need to know how the algorithm works, but basically it groups the detected boxes together based on physical and temporal proximity, then assign an ID to each “track”.
For example, if you have bounding box detection of a bird flying across the screen, one might use a tracking algorithm to track and assign an ID to the bird across frames.
Here, we use the same type of algorithm to assign detections into “behavioural events”.
The script to do this is Code/5_GetEvents.py, but before this,you will need to have the detections output as pickle format (see above), and also define the hyper-paramters for the alogrithm is a seperate json file.
Here is a sample hyper parameter file, you can also find this in ./Data/JaySampleData/Jay_Sample_HyperParameters.json
{
    "Eat": {
        "min_duration": 1.0,
        "YOLO_Threshold": 0.1,
        "max_age": 21.0,
        "min_hits": 1.0,
        "iou_threshold": 0.2
    }
}
- The json basically stores a python dictionary, with the first level being the name of the behaviour (It needs to be the same as the YOLO output), then each behaviour has a set of hyperparamters.
min_duration: The minimum duration of a track to be considered an event
YOLO_Threshold: The confidence threshold from YOLO to consider a detection
max_age: The maximum number of frames a track can be inactive before being deleted
min_hits: The minimum number of hits to create a track
iou_threshold: The overlap in bounding boxes to consider them the same track
The most important hyper-paramters are probably min_duration and YOLO_Threshold, which will vary depending on the type of behaviour and video you have.
For example, an increased minimum duration or a higher YOLO threshold will be useful to filter out super short detections/ wrong detections that might be false positives, but ofcourse depends on the length of the behaviour of interest.
Here, I defined the best hyperparamters for the Jay dataset, based on a grid search optimization (See next section) as an example. If you are applying this to a new dataset, you can definitely play around with the parameters a little first to get a feel of how each paramter differs, since running a whole optimization algorithm might be a little daunting at first.
To run the event detection on the Jay sample video, you can run this in the terminal:
python Code/5_GetEvents.py --Detection "./Data/JaySampleData/Jay_Sample_YOLO.pkl" --Param "./Data/JaySampleData/Jay_Sample_HyperParam.json"
- The parameters are:
--Detection: Path to the YOLO detections in pickle format
--Param: Path to the hyperparameter json file
After running the script, it will output the detected events as a csv file, with the same name as the video, in the video’s directory.
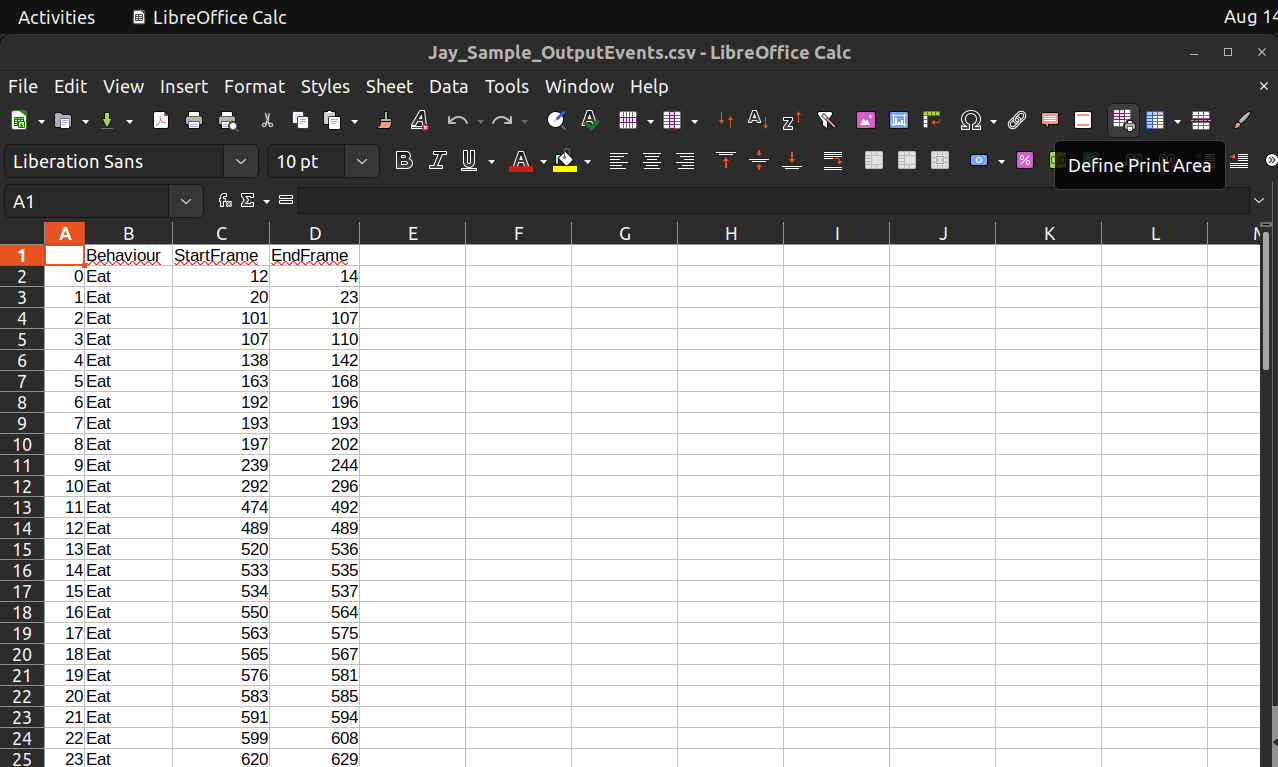
- The columns are the following:
Behaviour: The name of behaviour
StartFrame: Start frame of the behaviour
EndFrame: End frame of the behaviour
One could then use this information to further analysis, for example to calculate duration of events, or converting the frame numbers to actual time, based on the frame rate of the video.
Next section, I will go through the model validation and optimization using grid search, which might need a bit more customization and coding for new datasets, since it will depend on the format of your manual annotation! However, I do really encourage you to validate the model before you apply it to process data on a study (even if the detections looks really good from the videos!).